Sample Excel Dashboards
A selection of anonymized Excel dashboards and reporting systems built for growing businesses, from cash flow forecasting to inventory planning and executive KPI reporting.
Dashboard Portfolio
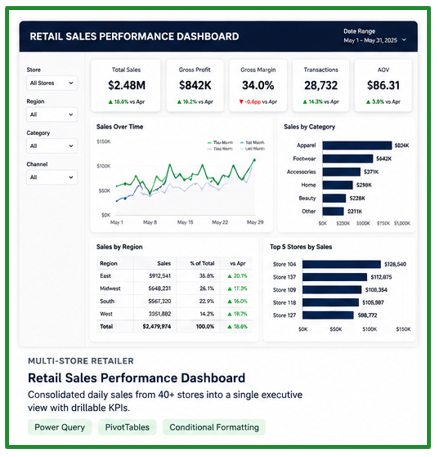
Multi-Store Retailer
Retail Sales Performance Dashboard
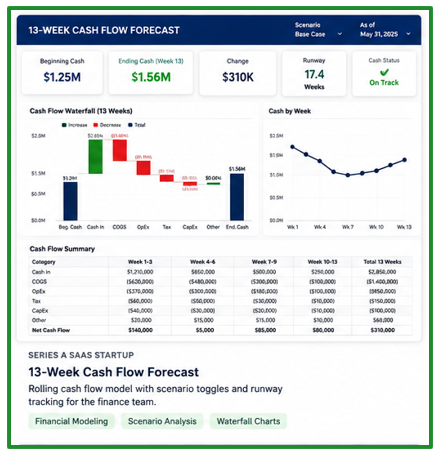
SaaS Startup
13-Week Cash Flow Forecast
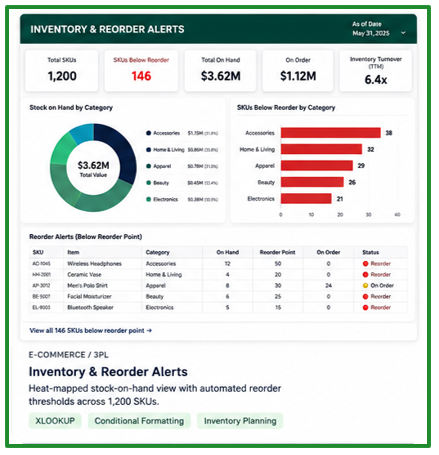
E-Commerce / 3PL
Inventory & Reorder Alerts
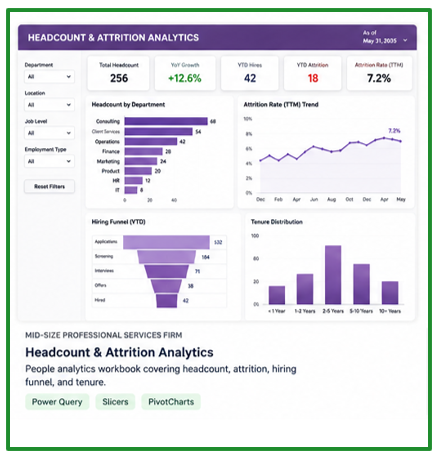
Professional Services
Headcount & Attrition Analytics
Construction Services
Project Portfolio Tracker
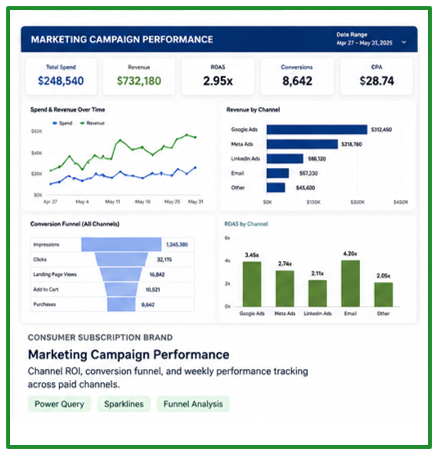
Subscription Brand
Marketing Campaign Performance
Got a spreadsheet that needs this treatment?
Every project starts with a short conversation to understand the workbook, the reporting problem, and the decision it needs to support.
Start a Project